Chapter 1.
Unlock Clean Energy at Scale
Published
Clean energy is dominating new generation buildout
The United States is building new power generation capacity at a record pace, with 86 gigawatts (opens in a new tab) (GW) of new generation capacity expected to be added to the grid in 2026, an annual rate of additions that is more than twice as fast as the last decade.1 The backbone of this buildout is solar, wind, and energy storage, which together account for over 90% of expected additions to the grid in 2026 and 2027. These resources are leading the market because they are cheap, quick to build, and independent from volatile commodity fuel markets.
Structural barriers are preventing clean energy resources from realizing their full potential
Clean energy additions are keeping the lights on, but demand growth is outpacing the rate we can add new resources to the grid. Structural barriers are preventing clean energy resources from realizing their full potential:
- Siting and permitting is too complex. Developing new large-scale power projects involves navigating a complex maze of state and local siting processes, proliferating siting restrictions on solar, wind, and energy storage, and uncertain and unpredictable federal policy environment.
- The interconnection queue is jammed. Over 2,000 GW of capacity remains stuck in line, waiting an average of five years to connect to the grid.2
- Clean energy investment and deployment is uneven. California and Texas account for nearly 40% of solar, wind, and energy storage built since the start of 20253, driven by these states’ policy and market environments. Meanwhile, PJM, the largest electricity market in the U.S., has experienced anemic growth in new capacity despite three years of capacity price spikes that hurt consumers across the region.4
Americans deserve clean, reliable energy. This section outlines actions state policymakers can pursue in three areas: siting and permitting, connecting to the grid, and mobilizing investment. Progress across all three of these areas will unlock large-scale clean energy to power this moment and the future.
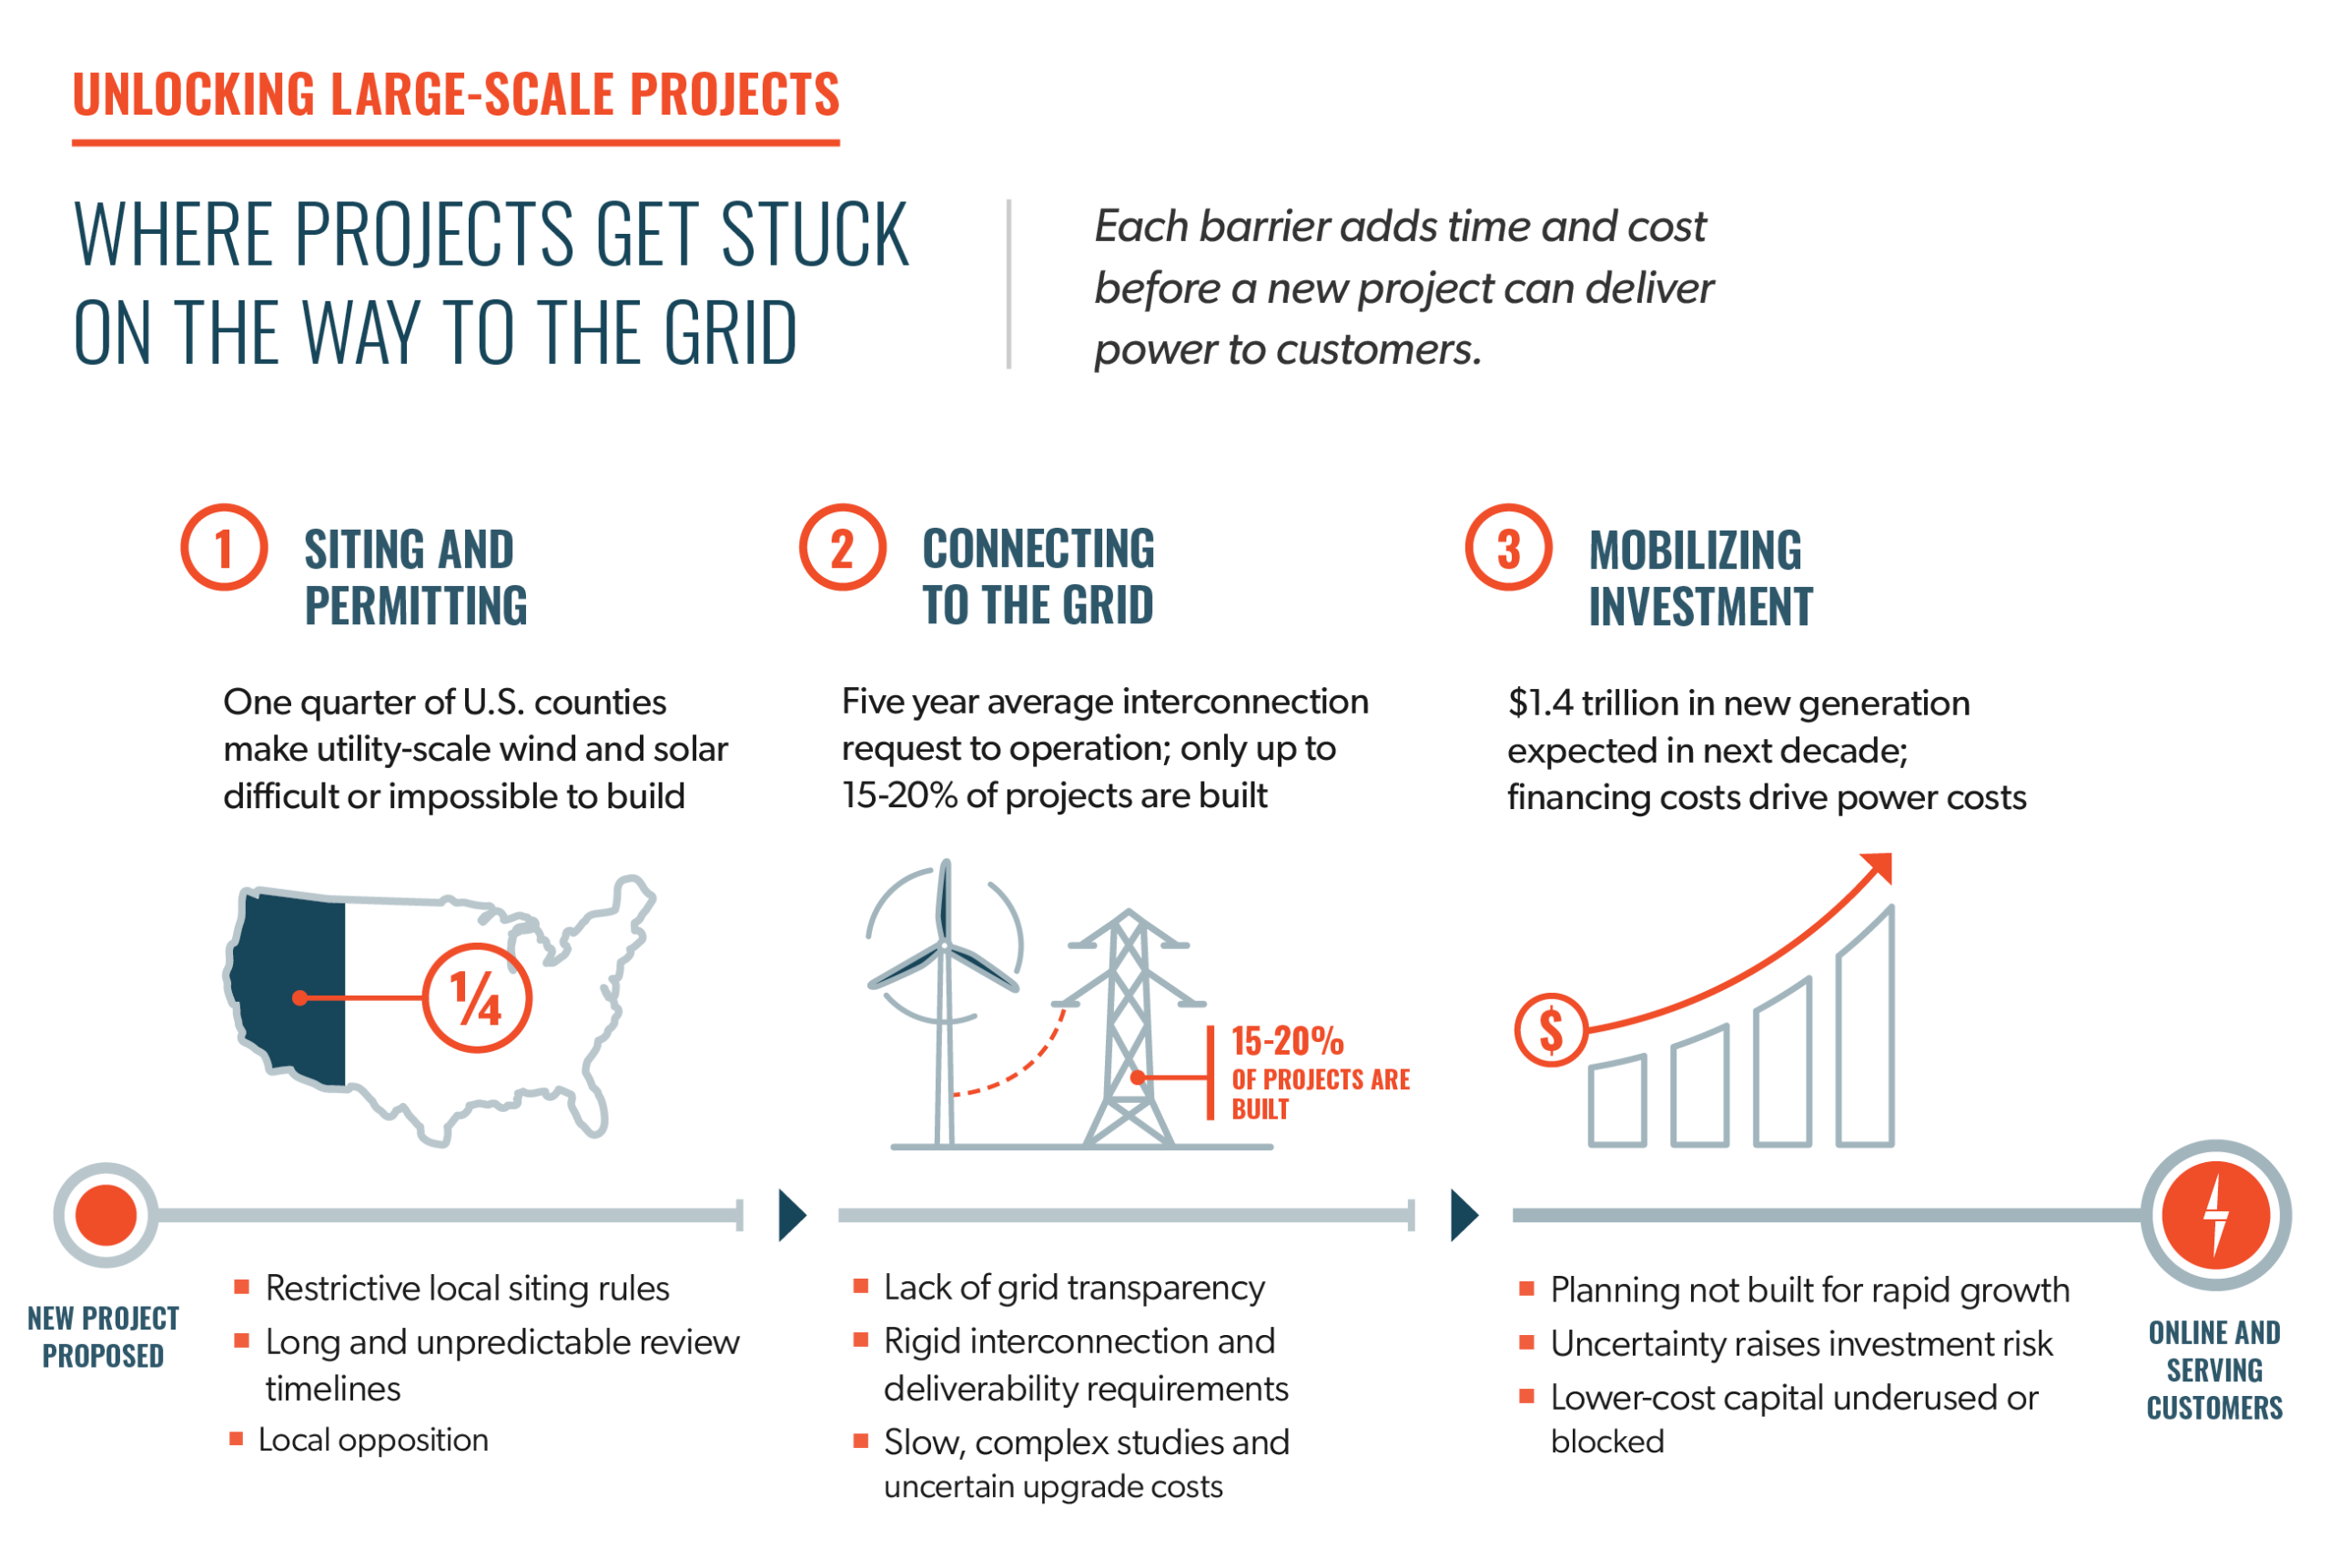
Text version of this graphic
Where projects get stuck on the way to the grid. Each barrier adds time and cost before a new project can deliver power to customers.
From “New project proposed” to “Online and serving customers”:
- Siting and permitting. One quarter of U.S. counties make utility-scale wind and solar difficult or impossible to build.
- Restrictive local siting rules
- Long and unpredictable review timelines
- Local opposition
- Connecting to the grid. 5 year average interconnection request to operation; only up to 15-20% of projects are built.
- Lack of grid transparency
- Rigid interconnection and deliverability requirements
- Slow, complex studies and uncertain upgrade costs
- Mobilizing investment. $1.4 trillion in new generation expected in next decade; financing costs drive power costs.
- Planning not built for rapid growth
- Uncertainty raises investment risk
- Lower-cost capital underused or blocked
States can improve large-scale clean energy siting and permitting with policies that:
- Ease restrictive local siting rules by enacting sensible standards for local siting, or creating a one-stop shop at the state level for clean energy permitting with uniform standards.
- Reduce long and unpredictable review timelines by providing resources to permitting agencies, creating more efficient review processes, and setting clear and reasonable timelines for review.
- Expand community benefits and reduce local opposition through better community benefit and development agreements and pre-screening low-impact development areas with community input.
States can connect large-scale clean energy to the grid faster with policies that:
- Create more grid transparency by requiring utilities to evaluate opportunities to connect more resources using surplus interconnection capacity at existing points of interconnection, re-use interconnection from retiring generators, and publish information on grid interconnection capacity.
- Encourage more use of flexible interconnection approaches that avoid long wait times and expensive grid upgrades.
- Streamline studies and reduce upgrade costs with coordinated planning, and software tools that enable automated studies.
- Increase state capacity to engage in regional grid processes and with regional market operators by providing resources to build agency capacity and expertise.
States can mobilize more investment for large-scale clean energy with policies that:
- Plan proactively for rapid growth by improving demand forecasting approaches, utilizing competitive mechanisms to procure new resources, and managing fuel price risks.
- Provide clarity and certainty to market participants through clear procurement targets and pathways for large customers to bring their own new clean energy.
- Unlock lower-cost financing options by enabling market access for third-party project developers, providing low-interest loans to projects, and expanding public financing for new clean energy projects.
Sources
- U.S. Energy Information Administration (EIA), “New U.S. Electric Generating Capacity Expected to Reach a Record High in 2026,” Today in Energy, February 20, 2026, https://www.eia.gov/todayinenergy/detail.php?id=67205 (opens in a new tab). ↩︎
- Lawrence Berkeley National Laboratory (LBNL), “Queued Up: Characteristics of Power Plants Seeking Transmission Interconnection,” 2026 edition, accessed October 27, 2026, https://emp.lbl.gov/queues (opens in a new tab). ↩︎
- Based on analysis of EIA 860M data. U.S. EIA, “Preliminary Monthly Electric Generator Inventory (Based on Form EIA-860M as a Supplement to Form EIA-860),” September 2026 data, October 23, 2026, https://www.eia.gov/electricity/data/eia860m/ (opens in a new tab). ↩︎
- Nikhil Kumar, “Interconnection Bottlenecks Cost PJM Customers $3.5 Billion,” GridLab, November 6, 2025, https://gridlab.org/interconnection-bottlenecks-cost-pjm-customers-3-5-billion/ (opens in a new tab). ↩︎